1. The Sources Panel #
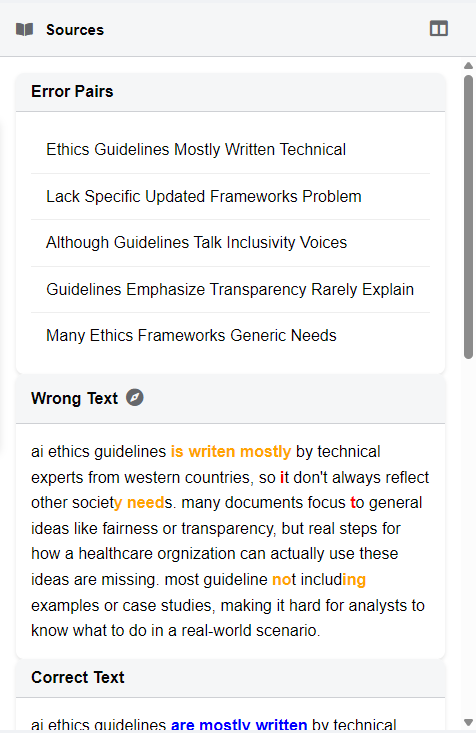
When text processing is complete, Error Analyzer opens into the main workspace. This workspace is divided into three vertical panels. The left-hand panel, known as the Sources Panel, serves as the navigation hub of your project. Its function is not analytical in itself but organizational: it allows you to move efficiently through your dataset and to interpret the system’s visual display of corrections.
Panel Header #
At the very top, the panel is marked with the label Sources. Next to the title is a toggle button, which lets you collapse or expand the panel. Collapsing the panel creates additional space in the central and right-hand areas, useful when you wish to concentrate on detailed annotation or analysis.
Error Pairs List #
Beneath the header, the Error Pairs list presents every text pair you uploaded from your CSV file.
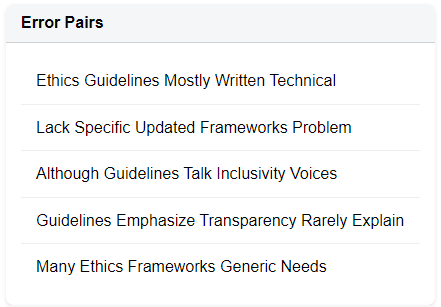
- Each entry corresponds to a pair of texts (original and corrected).
- The items appear in a scrollable list, labeled either by the titles you provided or by a default designation such as Pair 1, Pair 2, and so on.
- Clicking on an item immediately loads that pair into the source panel, displaying the texts in their respective frames, with color-coded changes and associated linguistic data.
This list is the primary means of navigation within your dataset, allowing you to move directly to the material you want to examine.
The Legend #
At the bottom of the panel, a Legend explains the color-coding used in the text comparison view. This coding system is consistent across the entire application and distinguishes different types of textual variation:
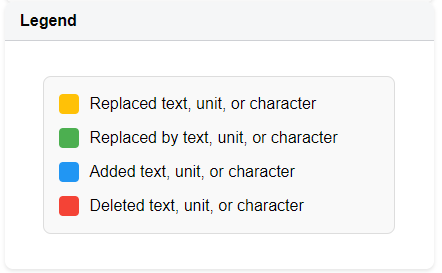
- Replaced text: original text that has been changed.
- Replaced by text: the new text that replaces it.
- Added text: entirely new material introduced in the corrected version.
- Deleted text: material removed from the original.
This legend functions as a permanent reference guide, ensuring that the meaning of the visual markings is always clear, even when reviewing multiple projects or datasets.
2. The AI Workspace #
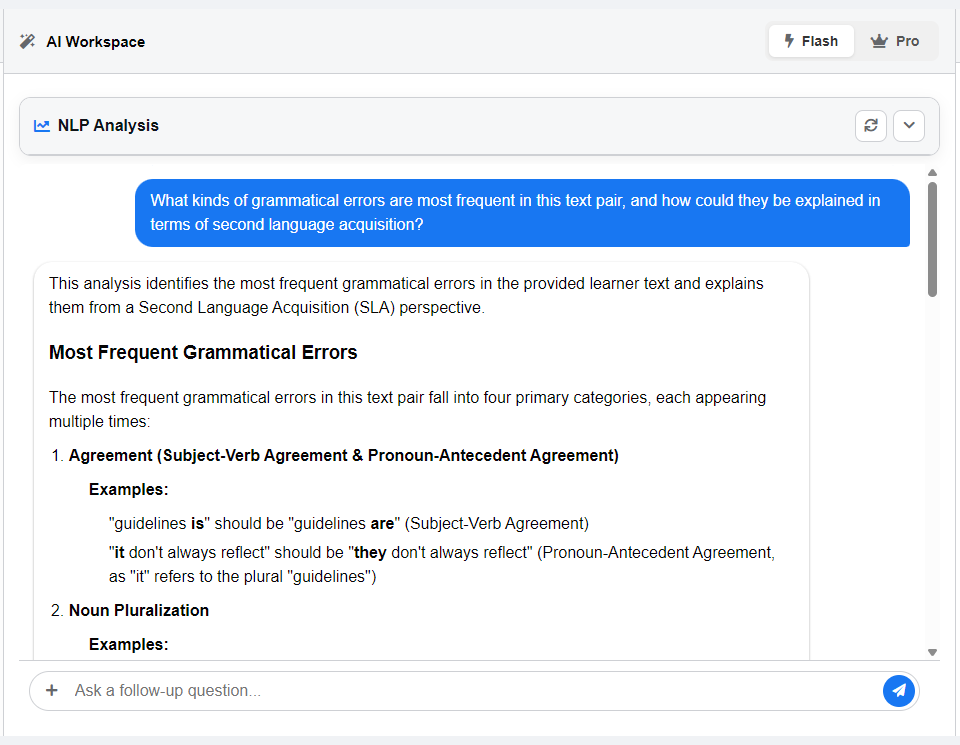
The central panel of Error Analyzer is the AI Workspace, the most dynamic component of the application. It serves as both a presentation space for the automated linguistic analysis and an interactive environment where you can directly engage with the AI. In this panel, you do not simply view processed data—you interrogate it, test hypotheses, and even command the system to perform actions that extend your own analysis.
Panel Header #
At the top of the workspace, you will find controls that frame the analytical context:
- Title: The header labeled AI Workspace, often accompanied by a magic wand icon, signals that this panel hosts advanced computational tools.
- AI Model Selector: Two buttons typically appear, labeled Flash and Pro.
- Flash prioritizes speed. It is suited for quick checks, simple classifications, or exploratory queries where rapid feedback is more important than nuance.
- Pro prioritizes depth. It is slower but designed for complex reasoning, detailed linguistic explanations, and comprehensive summaries.
This selector allows you to balance speed against depth according to the needs of your analysis.
Analysis Output Area #
The central display of the panel contains the results of the automated Natural Language Processing (NLP) analysis. The system organizes this information into interactive tabs that make the underlying linguistic blueprint visible and accessible.
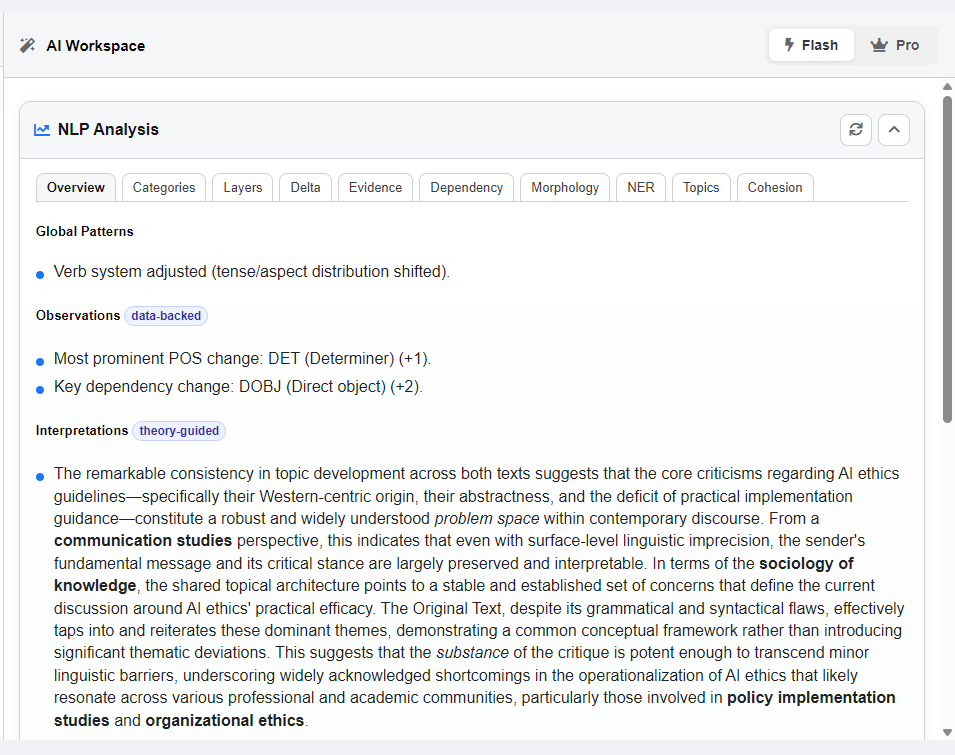
- Overview / Categories: High-level summaries that classify the text or highlight its general characteristics.
- Dependency: A tree diagram that maps the grammatical structure of each sentence, showing relationships such as subject–verb, modifier–head, and object–predicate.
- Morphology: A token-by-token breakdown of the text. Each word is shown with its lemma, part of speech, and grammatical features (for example, tense, number, mood).
- Named Entity Recognition (NER): A list of proper nouns automatically identified and categorized as Person, Place, Organization, and so on.
This area provides the “objective” layer of analysis, generated consistently by the computational engine and available for you to interpret and build upon.
Chat Interface #
At the bottom of the workspace is the interactive chat, which functions as your dialogue channel with the AI. It combines a conversational mode of inquiry with direct analytical tools.
- Chat History: A running record of your exchanges with the AI for the currently selected text pair. This log acts as documentation of your interpretive process.
- Chat Tools: Accessed via a “+” button beside the input field.
- Auto Tag: Automates annotation. For example, you may type: “Tag all instances of incorrect verb tense.” The AI applies the relevant tags systematically, reducing repetitive manual work.
- Web Search: Expands the AI’s reach beyond your dataset. Questions like “Compare these error patterns to models of second language acquisition” trigger both project-level analysis and a live web search, allowing results to be situated in a broader academic context.
- Active Tool Indicator: A small label confirms when a special tool is active, ensuring clarity before you submit a command.
- Input Field and Send Button: Where you type your queries or instructions and execute them.
A Dual System: Data and Interaction #
The AI Workspace unites two complementary dimensions of research:
- The Analysis Output Area presents structured, machine-generated findings—the what is of your data.
- The Chat Interface allows you to interrogate and act upon those findings—the what if and the do this of your analytical process.
Together, these layers transform the workspace into more than a viewer of results. It becomes a space where structured evidence and interpretive inquiry meet, enabling researchers to combine methodological rigor with computational support in a single environment.
⚠️ Reminder for researchers: While the automated outputs are consistent, they are not infallible. Always treat AI-assisted results as a complement to your expertise, not a replacement for it. Verification against your own linguistic knowledge is essential for reliable conclusions.
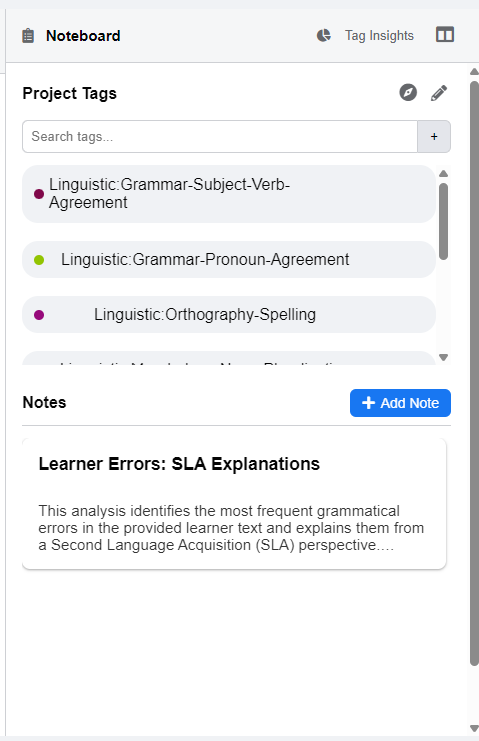
3. The Noteboard #
The panel on the far right of the workspace is the Noteboard. If the AI Workspace provides automated analysis and interactive exploration, the Noteboard is where you bring in your own expertise. It is the space for systematic annotation, the construction and refinement of your tag schema, and the recording of detailed observations. Together, these functions transform the Noteboard into the command center for human interpretation.
Panel Header #
The header at the top provides orientation and quick navigation:
- Title: A label marked Noteboard with a clipboard icon identifies this panel as your space for recording and organizing information.
- Tag Insights Link: A shortcut with a pie chart icon that opens the Tag Report. This feature lets you move easily from detailed analysis of individual texts to a project-wide summary of tag usage.
- Toggle Button: Allows you to collapse or expand the Noteboard, freeing space for the central panel when you wish to focus on text-level analysis.
The Tag Library #
The Tag Library is the methodological core of the Noteboard. It represents your analytical framework, housing the system of categories that you apply to the data.
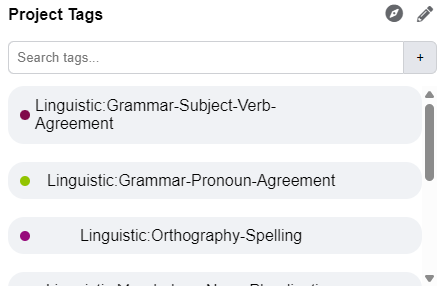
- Header and Actions: The section titled Project Tags includes key controls:
- Explore/Filter Button: Lets you filter or explore your dataset based on the annotations you have applied.
- Modify Tags Button: Activates edit mode, enabling bulk changes to your tag set.
- Search and Create: A text field with a “+” button has two functions. You can search for existing tags in real time, or you can type a new tag name and add it to your library.
- Modification Tools: When edit mode is active, additional options such as Select All and Delete Selected appear, allowing you to reorganize your schema efficiently.
- Tag List: A scrollable list displays all project tags, each with its assigned color. This collection embodies your coding scheme and provides the foundation for systematic annotation.
Notes Section #
The lower part of the Noteboard is dedicated to Notes, which serve as a qualitative companion to your structured tags.
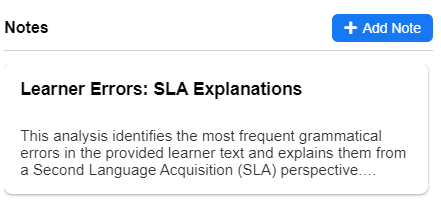
- Add Note: Clicking Add Note opens a text editor where you can write a title and detailed content.
- Notes List: Displays all notes linked to the current text pair. Unlike a general diary, these notes are tied specifically to the example on your screen, ensuring that justifications, interpretations, or reflections remain contextually grounded.
This design allows you to preserve both systematic coding and open-ended commentary, which together support a more comprehensive analysis.
The Role of the Noteboard #
The Noteboard integrates structure with interpretation. On one hand, it allows you to create and refine a transparent, reproducible tagging system. On the other, it offers space for reflective notes, enabling you to capture nuance, ambiguity, and evolving hypotheses. Used together, the Tag Library and Notes section ensure that your analysis remains both systematic and interpretive, aligning computational support with scholarly judgment.