You can access the Tag Insights page from the Noteboard panel on the right by clicking the Tag Insights link with the pie chart icon. This opens the main reporting dashboard of Error Analyzer, where you can review results and generate summaries.
For researchers, this page represents the transition from annotation to interpretation. It consolidates your coded data, links it with linguistic analyses, and structures your qualitative notes into forms that can be examined, compared, and reported.
The page provides a complete overview of your project through three dedicated tabs:
- Tag Report – Browse, filter, and interact with annotations to see how your coding decisions manifest across the dataset.
- NLP Analysis – Visualize linguistic patterns across the corpus to ground qualitative insights in quantitative distributions.
- Notes Report – Consolidate and synthesize the interpretive layer of your research through the notes you created.
Tab 1: Tag Report (Default View) #
This tab is the analytical core for your annotations.
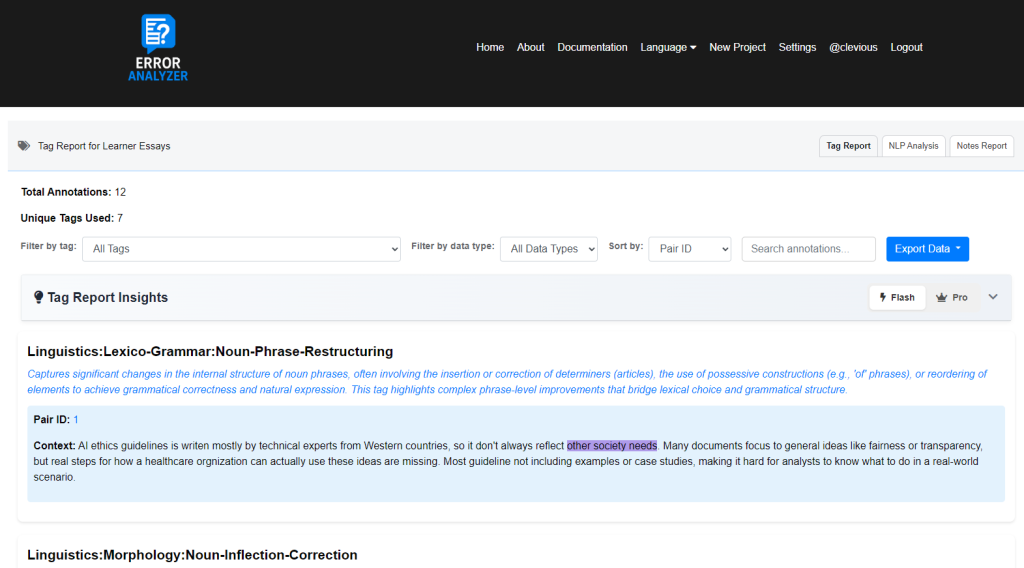
- Purpose in Qualitative Analysis: It allows you to move from isolated coding decisions to systematic pattern recognition. By filtering and grouping, you can trace recurring error types, explore their distribution, and connect them back to the original texts.
- Key Features:
- Filter Bar: Refine the dataset to focus on a single error type, a text type (Wrong, Corrected, Diff), or a thematic subset. This supports targeted inquiry.
- Annotation Browser: Provides context for each coded segment, allowing you to validate consistency and revisit interpretive choices.
- AI Chat: Lets you interrogate your annotations and tags in any way you choose, providing on-demand summaries, thematic insights, and flexible exploration limited only by your questions.
- Data Export: Enables you to take coded data into external tools (e.g., R, NVivo, Excel) for triangulation or advanced analysis.
Tab 2: NLP Analysis #
This tab aggregates the automated linguistic analysis across your entire project.
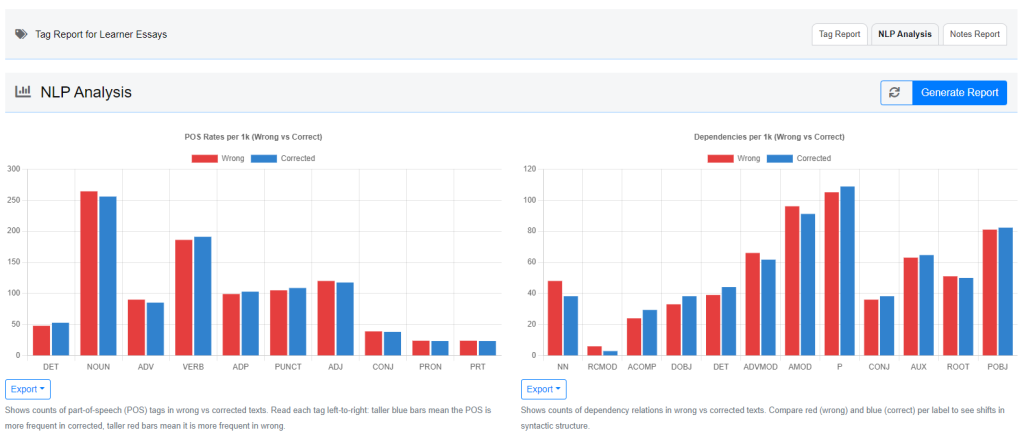
- Purpose in Qualitative Analysis: It situates your interpretive coding within measurable linguistic patterns. While tags capture your theoretical categories, the charts here show structural shifts between Wrong and Corrected texts, helping you connect micro-level observations to macro-level tendencies.
- Key Features:
- Dashboard of Charts: Visualize POS distributions, dependency structures, tense and number changes, and more. This allows you to test whether the corrections reflect broader linguistic development or isolated fixes.
- Generate Report Button: Produces a narrative summary that integrates the charts into an interpretable account, bridging raw quantitative data with qualitative meaning-making.
Tab 3: Notes Report #
This tab gathers your interpretive writing into a single, analyzable layer.
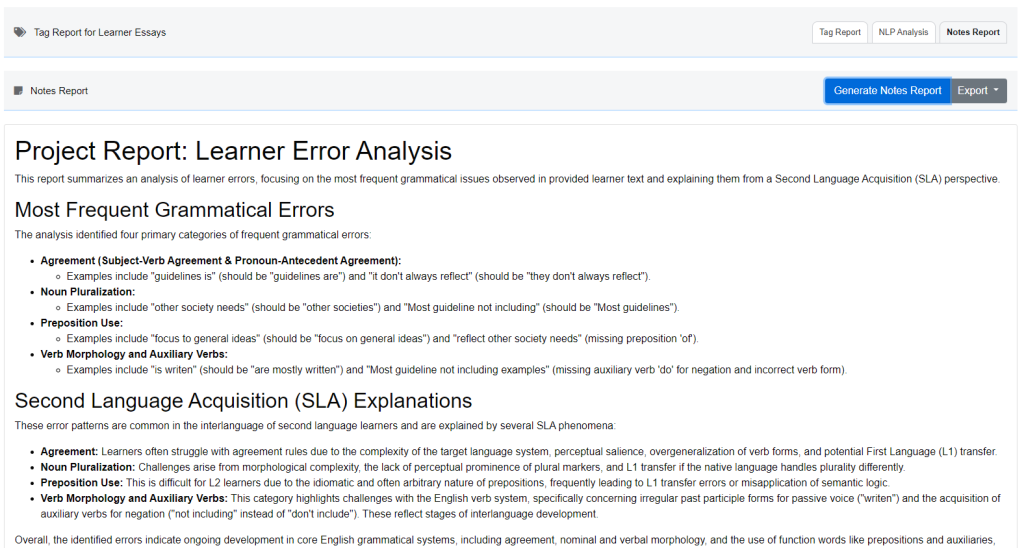
- Purpose in Qualitative Analysis: It is where the researcher’s voice becomes central. Notes capture hypotheses, contextual insights, and theoretical reflections that cannot be reduced to tags or counts. Consolidating them makes it possible to trace the evolution of your interpretations across the dataset.
- Key Features:
- Generate Notes Report: Uses an LLM to synthesize your scattered notes into a coherent draft report. This supports the shift from raw observations to structured argumentation.
- Automated Summary: Highlights recurring themes and aligns them with the evidence you documented.
- Export Options: Allows you to archive or share interpretive findings in research-ready formats (Markdown, TXT, HTML).
Significance for Researchers
The Tag Insights page is not just a reporting utility. It is where coding decisions, linguistic evidence, and interpretive reflections converge. Together, the three tabs help you answer the key qualitative questions: What errors occur most often? How do they manifest linguistically? Why do they matter in this context?